Getting Started
Correlation matrices — Portrait Documentation
Correlation matrices in psychometric profiling are tools used to analyze the relationships between variables measured through psychological tests or questionnaires. These matrices show the correlation coefficients between the different variables, allowing psychologists and researchers to better understand how different characteristics or traits influence each other.
Correlation matrices in Portrait psychometric profiling
With Portrait it is possible to create correlation matrices (traffic lights) through the dedicated interface, as shown in the figure below:
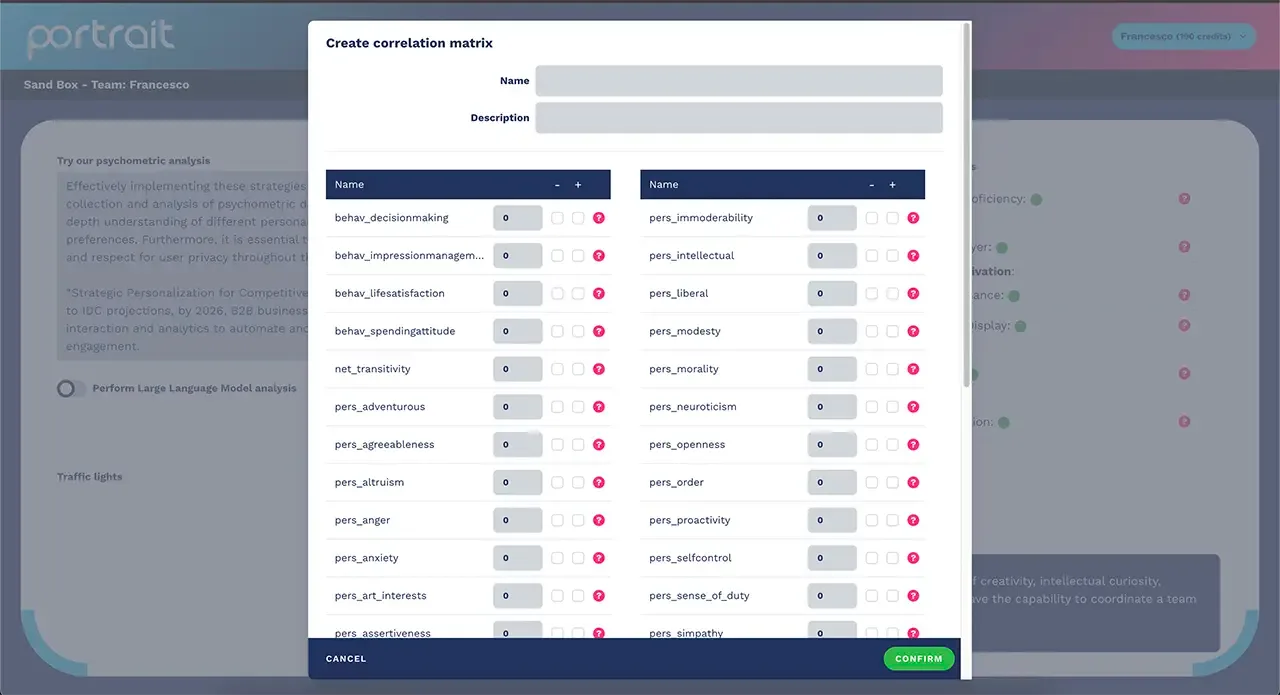
Correlations can be positive, negative or zero, indicating the type and intensity of the relationship between two variables. For example, a positive correlation between two traits suggests that they tend to increase or decrease together, while a negative correlation indicates that they vary in opposite directions.
Correlation matrices are often used in the construction and validation of psychometric instruments, in outlining psychological profiles and in scientific research, to better understand the structure of psychological traits and their interconnections. This analysis can also be used in application contexts such as marketing campaigns, communication, sales, personnel recruitment, professional orientation, psychological assessment and many other cases, such as churn propensity or the insolvency risk of an insurance policy.
Portrait's traffic lights
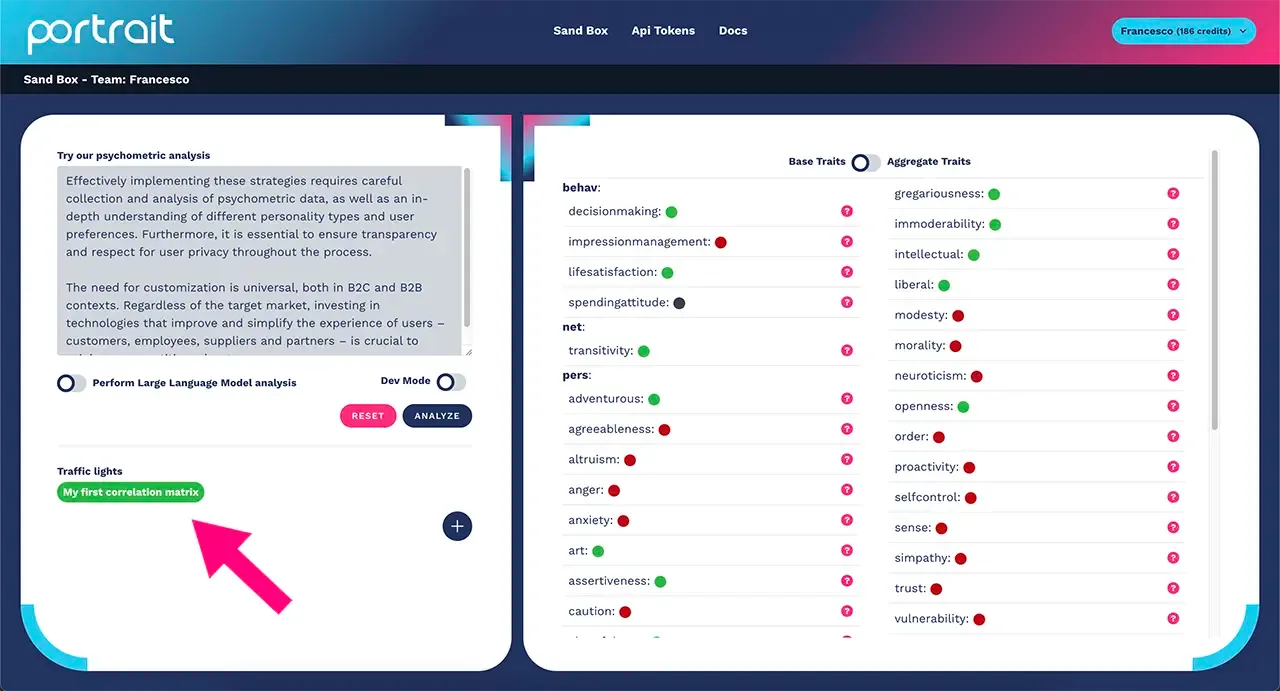
With Portrait you can create traffic lights that will turn on when your profiled users have the characteristics you identified in the correlation matrix (see the documentation chapter dedicated to how to create a matrix).
Where to source the data to build your matrix
You have 2 ways to create your own correlation matrix.
Use data you already have
You can run several profiling sessions on your database and see which psychometric traits your group of users have in common.
Psychology studies
There are many psychology studies where you can source data on the psychometric traits belonging to a certain type of user.
Correlation matrices, psychometric profile, values, weights and examples
- What is a psychometric profile? A psychometric profile is like a portrait of a person's personality, created through assessments and tests that measure various psychological traits.
Correlation matrix
- What is a correlation matrix? Think of the correlation matrix as a large table where each row and column represents a different personality trait.
- What is the purpose of the correlation matrix? It is used to see how each personality trait interacts with the others and contributes to the overall profile.
Matrix values (from -1 to +1)
Signs (+ and -) and weights (from -1 to +1): imagine that we are giving a score, or weight, to each personality trait. A value of:
- +1 means the trait is strongly present in a positive sense (it contributes a lot).
- -1 means the trait is strongly present in a negative sense (it does not contribute much, or works against the profile).
- 0 means the trait has no effect.
How it works in practice
Assigning weights and signs: for each personality trait, we decide whether the trait matters and in which direction (positive or negative). We then assign a weight with a sign:
- Positive weight (+): if the trait contributes positively.
- Negative weight (-): if the trait contributes negatively.
Calculating the overall profile: when we run a profiling, we multiply the value of each trait by the weight we assigned to it, taking the sign (positive or negative) into account. We then add up all these resulting values.
A concrete example
Let's use an example to clarify. Imagine we are looking at three personality traits: sociability, assertiveness and anxiety. We give sociability a weight of +0.8, assertiveness a weight of +0.6 and anxiety a weight of -0.5 (because anxiety could contribute negatively to overall well-being).
If a person has these values:
- Sociability = 0.7
- Assertiveness = 0.5
- Anxiety = 0.9
The sum will be: (0.7 × 0.8) + (0.5 × 0.6) + (0.9 × -0.5) = 0.56 + 0.3 − 0.45 = 0.41.
So, the final result of 0.41 gives us an idea of how, combined together, this individual's personality traits add up.
In summary
Every time we run a profiling, we apply the correlation matrix to get a numerical understanding of how the individual's various personality characteristics combine. This helps us see the bigger picture in a simple and measurable way.
NB: contact us if you need immediate support in creating your correlation matrix, or for a simple consultation.